Triple stain imaged with Zeiss LSM meta 510
Table of Contents
- Sample description and download
- Loading the data
- Options and parameters
- Examining the progress during runtime
- Analysing the results
Back to the main Page
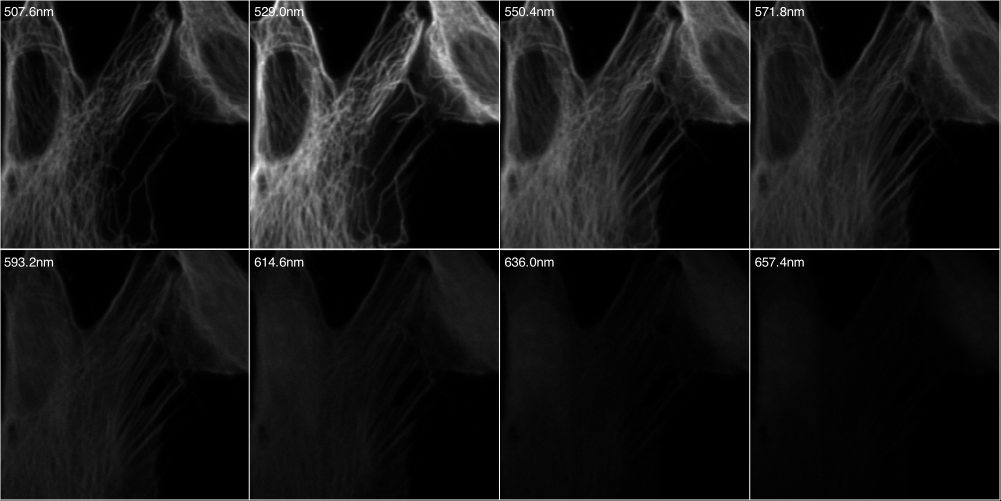
Download the data set from here. The data consists of an
image stack generated from adherent NIH-3T3 fibroblast cells. Therein, double-stranded
nucleic acids (mainly ribosomal RNA and nuclear DNA) were labeled with EtBr;
filamentous actin (F-actin) was stained with Alexa Fluor 532 (A532) conjugated phalloidin,
while tubulin was labeled with an Alexa Fluor 488 (A488) linked antibody.
The sample was imaged with a Zeiss LSM Meta 510 using 8 evenly spaced spectral
emission channels from 508 to 657 nm (width 21.4nm) and excited with a 488 nm laser.
PoissonNMF can load LSM files directly. Hence, start the plugin from the plugin menu
while no image is open. You will be asked to specify the type of data. Choose Zeiss LSM and locate
file the in the open dialog that follows. The image stack will be opened.
The first piece of information the plugin needs to know, is the number of sources the
data is to be decomposed into. Choose 3. Next, another dialog will appear,
in which the mandatory and optional information can be specified. The parameter dialog is shown in
the next figure. The number of iterations is preset to 100 (which is rather small, but suitable for
illustration purposes).
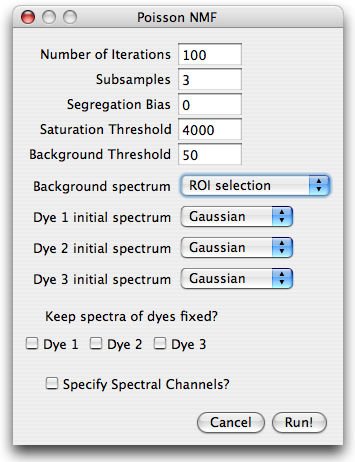 The image is taken with a 12bit AD converter, such that a saturation threshold
slightly below 4096 is appropriate. A background threshold of 50 is reasonable, but could be set higher. Higher background thresholds result in smaller runtime since the algorithm runs on a smaller data set.
For the background spectrum, select ROI selection, leave everything else as is and hit run.
Next, you will be prompted for a ROI which contains only background. Select a small region
without cells and press OK. The algorithm will start.
After the algorithm started, PoissonNMF opened a window displaying the spectra and a small
dialog with a Cancel and Least Square Solution.
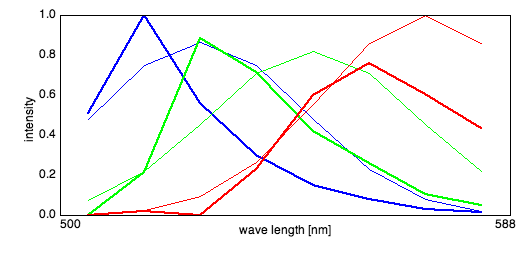
The plot shows the evolution of the estimated spectra and the initial spectra. If the spectra
look correct and don't change anymore, the user can interrupt the algorithm by pressing the
Least square solution button to use the current spectra to calculate a standard linear
unmixing solution. The progress of the algorithm is illustrated in the ImageJ progress bar.
After the last iteration finished, PoissonNMF displays an image stack containing the estimated
sources and opens a small dialog with functions to produce false color overlay of some of the
sources, save the spectra or display the background spectrum.
The spectra are normalized to unit area and the concentrations maps are scaled accordingly. Hence,
weak stains will appear weak in the NMF sources stack. If desired, they can be individually rescaled
using functions ImageJ provides.
The image is taken with a 12bit AD converter, such that a saturation threshold
slightly below 4096 is appropriate. A background threshold of 50 is reasonable, but could be set higher. Higher background thresholds result in smaller runtime since the algorithm runs on a smaller data set.
For the background spectrum, select ROI selection, leave everything else as is and hit run.
Next, you will be prompted for a ROI which contains only background. Select a small region
without cells and press OK. The algorithm will start.
After the algorithm started, PoissonNMF opened a window displaying the spectra and a small
dialog with a Cancel and Least Square Solution.
The plot shows the evolution of the estimated spectra and the initial spectra. If the spectra
look correct and don't change anymore, the user can interrupt the algorithm by pressing the
Least square solution button to use the current spectra to calculate a standard linear
unmixing solution. The progress of the algorithm is illustrated in the ImageJ progress bar.
After the last iteration finished, PoissonNMF displays an image stack containing the estimated
sources and opens a small dialog with functions to produce false color overlay of some of the
sources, save the spectra or display the background spectrum.
The spectra are normalized to unit area and the concentrations maps are scaled accordingly. Hence,
weak stains will appear weak in the NMF sources stack. If desired, they can be individually rescaled
using functions ImageJ provides.
Spectra and Sources
RBG false color overlay
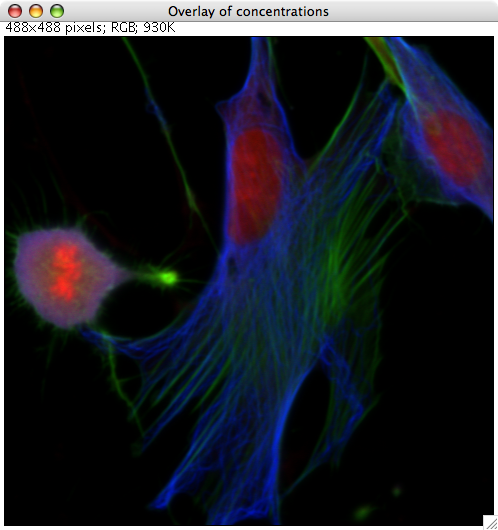
After pressing the RGB overlay button, a small dialog appears where the sources are assigned
to colors. PoissonNMF then produces a RGB picture according to the selection, where each source
is scaled to maximum intensity.

Background Map
The button Background map displays the partition of the image into background,
saturated regions and the parts used for the analysis. Pixels that fall below the
background threshold in every lambda channel are displayed in blue, the saturated
regions in red and the part used for the analysis in green.